Quarterly Market Review: Q2 2023
By: Paul Dickson, Director of Research and Giri Krishnan, Senior Portfolio Manager
An Unsinkable Economy?
A tight labor market and continued high consumer demand appear to have staved off a recession – possibly until 2024 (if even then). This resilience has meant continued inflationary pressures and points toward more Federal Reserve rate hikes this summer. So far, the U.S. economy has defied many economists’ more dire predictions. Hopes are growing for a “soft landing,” even after the most dramatic tightening of monetary policy since the early 1980s. The risks to this benign outlook and the “cracks” in the soft-landing narrative, while growing, appear to be contained, at least so far.
The second quarter of 2023 saw a continuation of the post-Covid economic recovery. Despite continued interest rate hikes at each Federal Reserve (Fed) meeting – with one pause in June – the economy performed remarkably well. According to the Atlanta Fed’s Gross Domestic Product (GDP) estimate “GDP Now”, the economy may have posted a 2.1% growth rate during the period. That would be higher than what most economists believe is the natural rate of around 1.8%, given modest productivity gains and slow population growth.
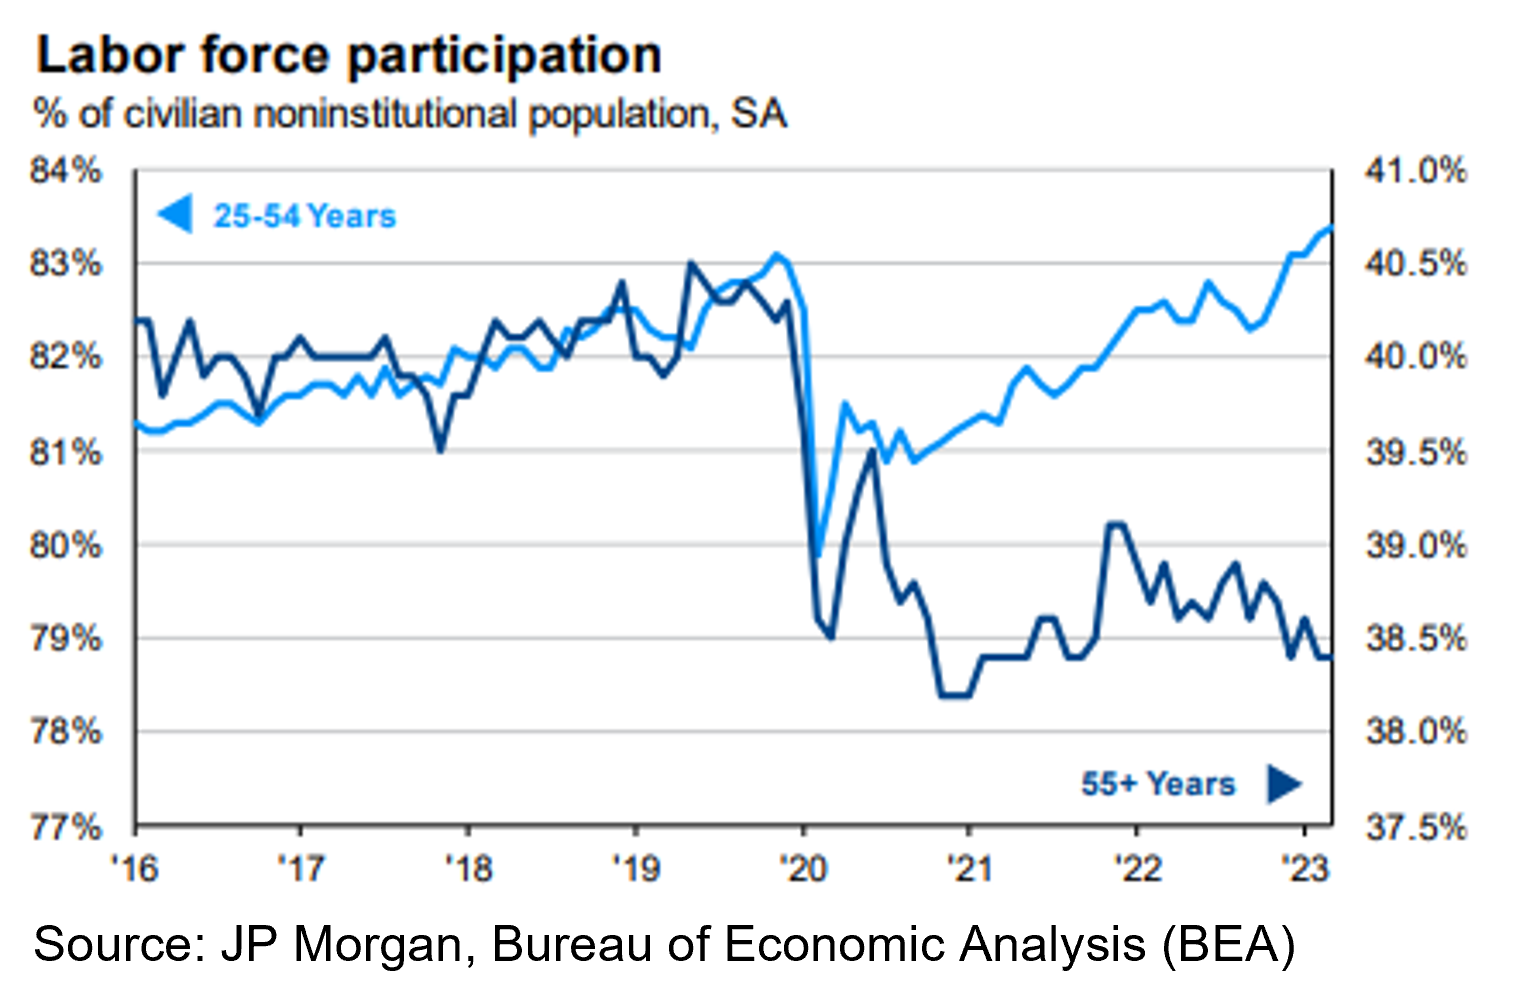
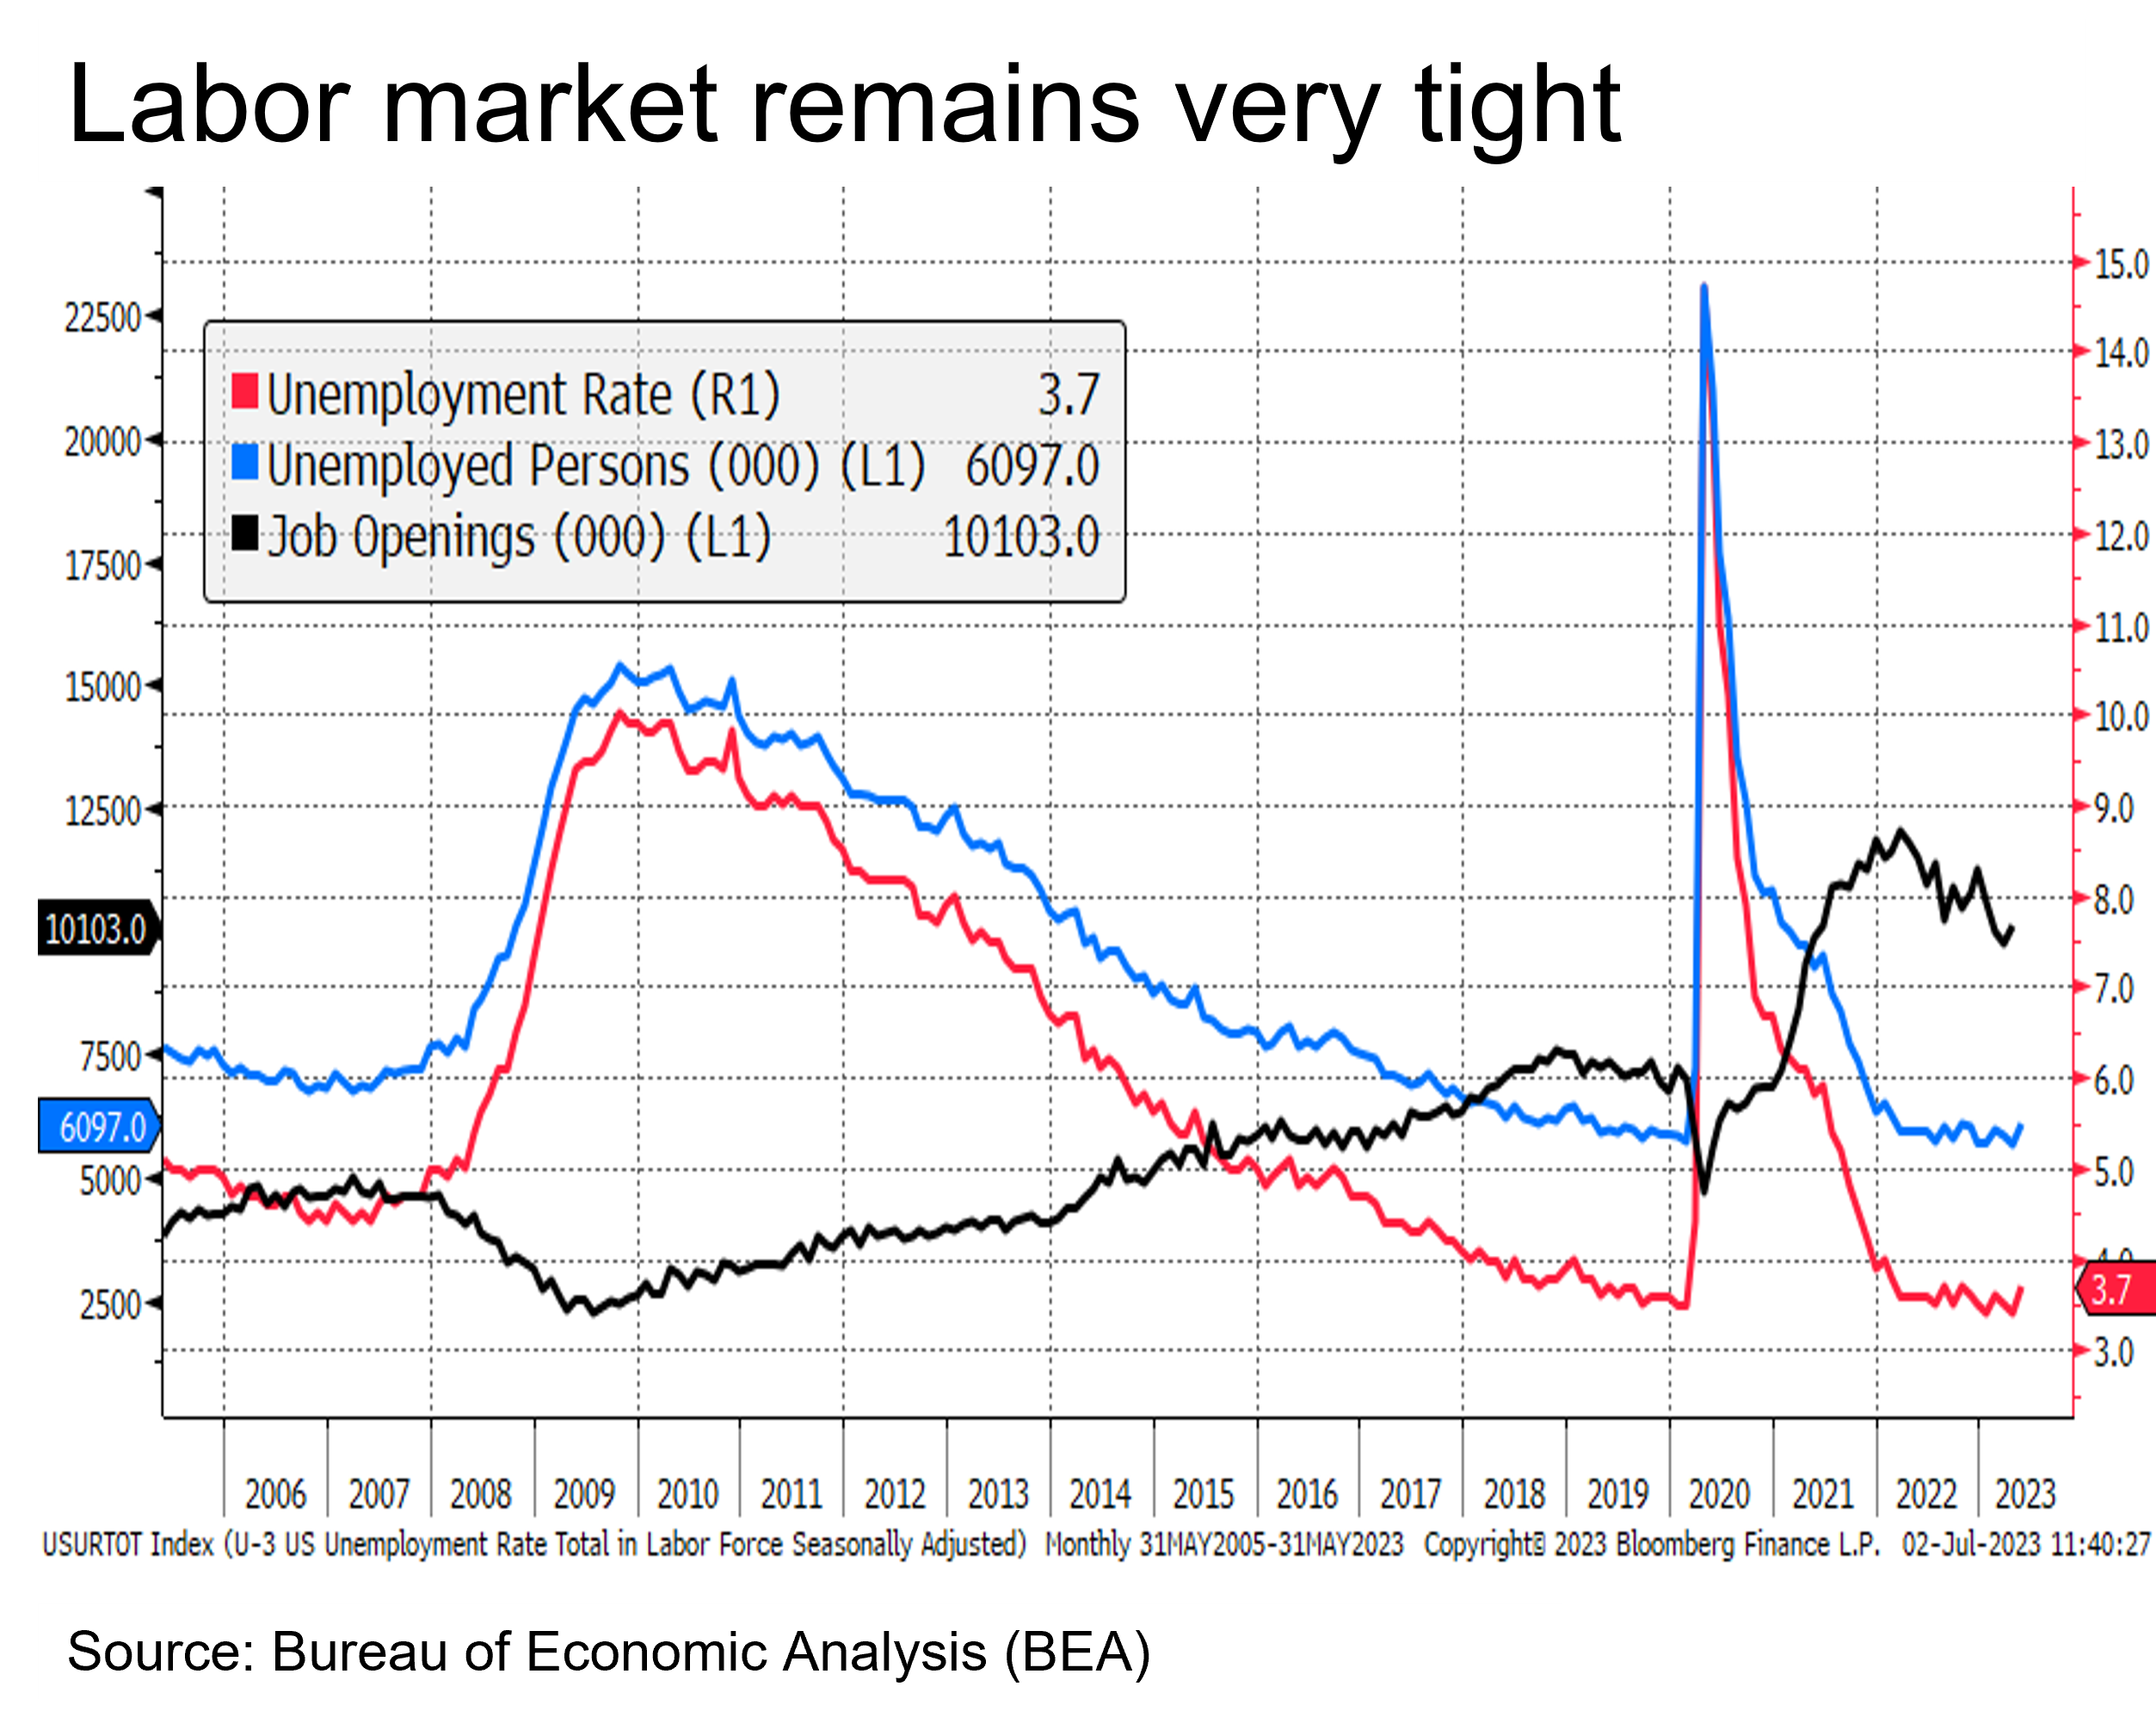
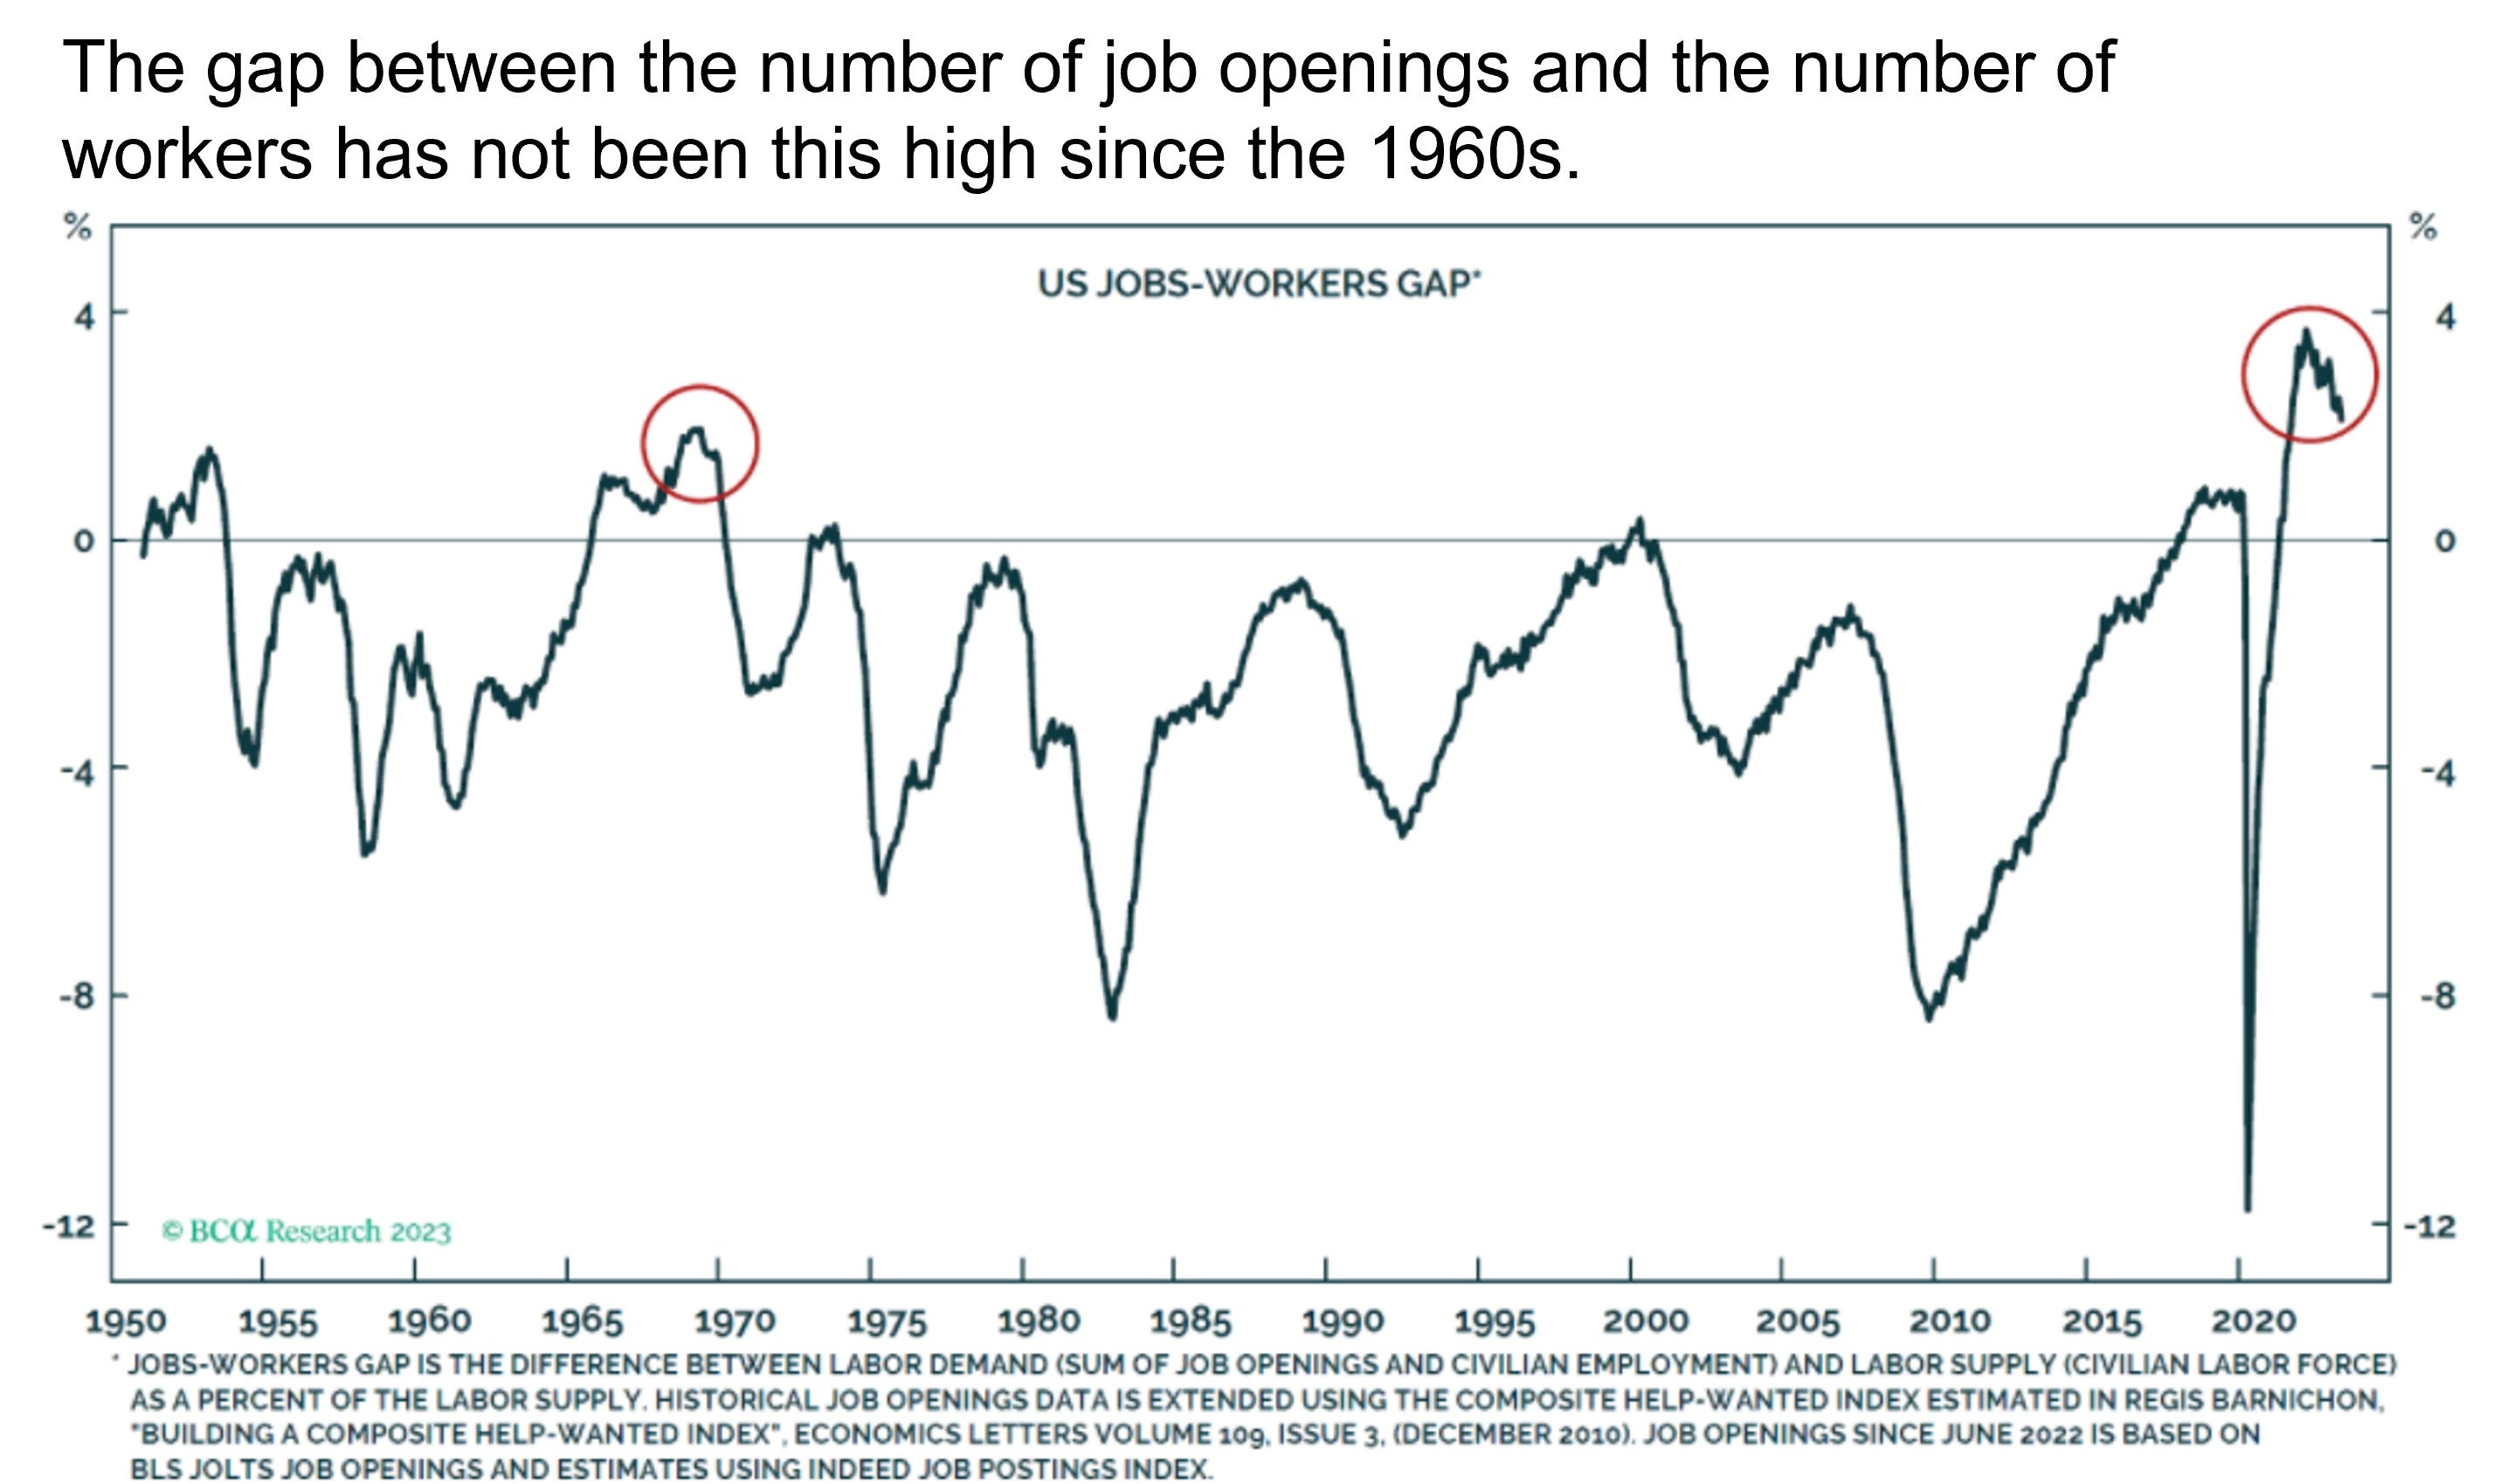
Due to the continued recovery, prime age workers continued to re-enter the labor force. As demand for them has outpaced supply, the unemployment rate has barely budged from all-time lows. Older workers in the 55 and older category have not seen a full recovery in participation rates and now are considered to have left the workforce, possibly permanently. Approximately 1.7 job openings remain for every unemployed person, so the labor market remains very robust. That tight labor market has contributed to rising compensation, which is a worry for policymakers. But, that rise in compensation appears to be at a measured and moderating rate.
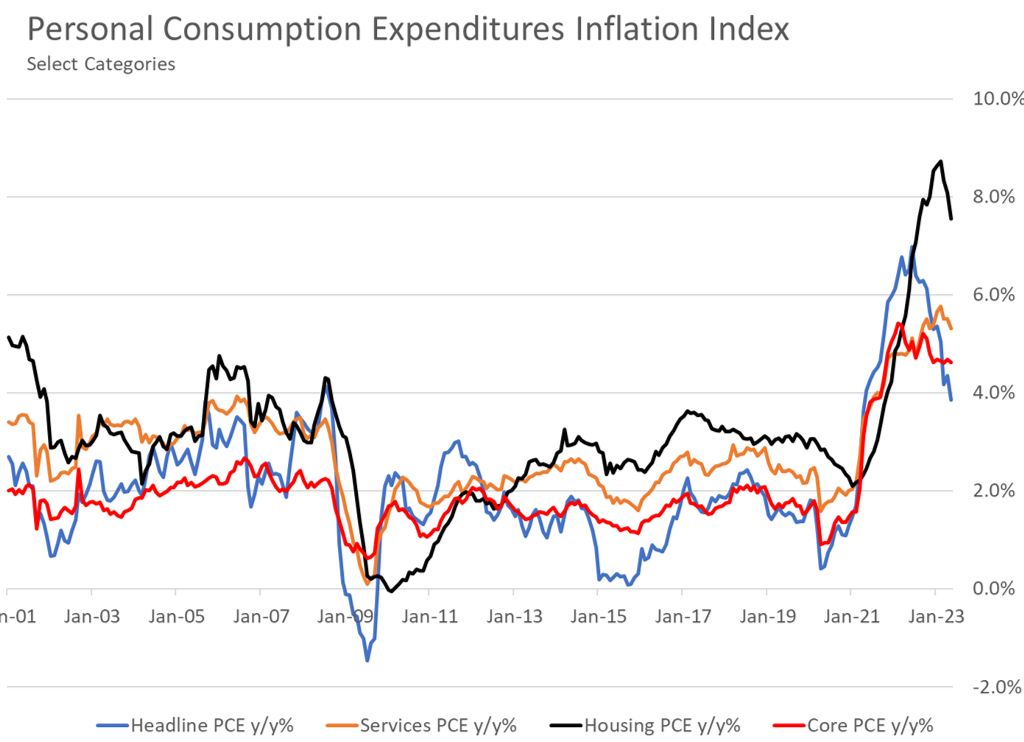
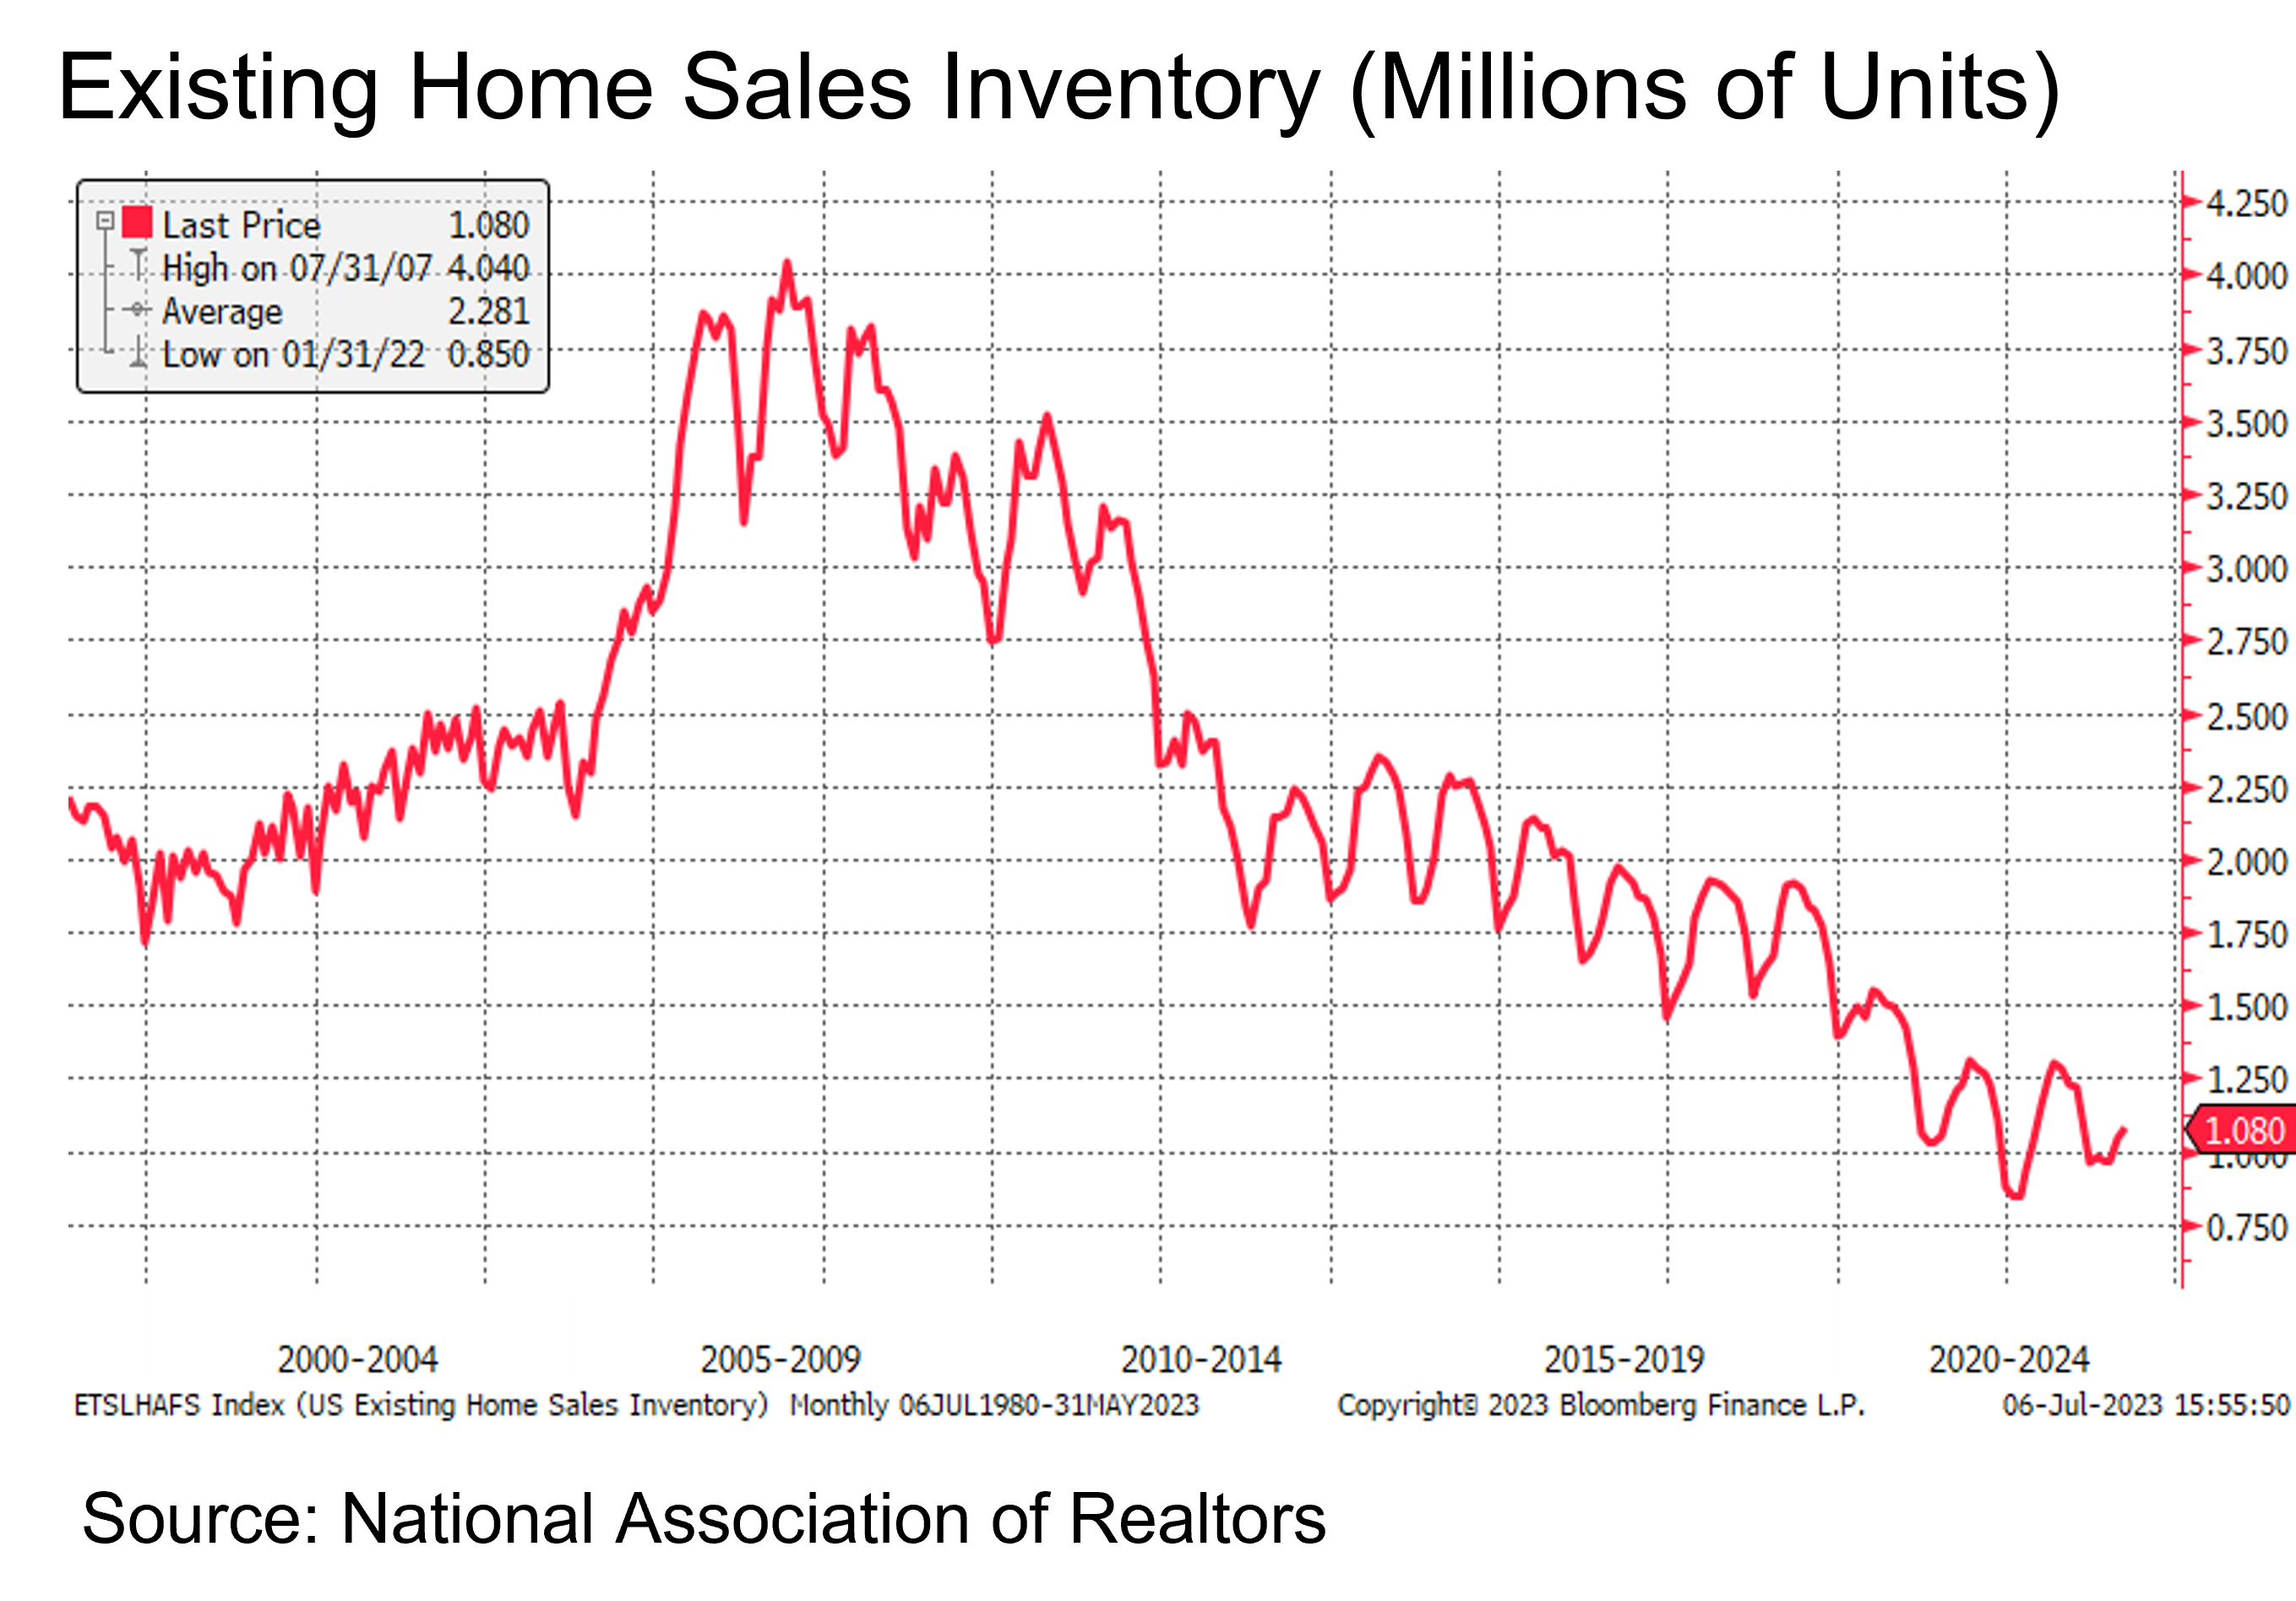
The other concern is the continued stubbornness of the services component of the inflation indices. The rising shelter inflation continues to complicate matters. While house prices have been moderating, rents and owner-equivalent rents, which are captured in the inflation data, continue to run at a high level. These measures of shelter inflation dominate the services component of both the CPI (Consumer Price Index) and the Federal Reserve’s preferred measure, the PCE (Personal Consumption Expenditures Index). While it is understood that there is a significant lag between changes in monetary policy and its impact on shelter prices, the number stands out as particularly worrisome given relative shortages in the housing market.
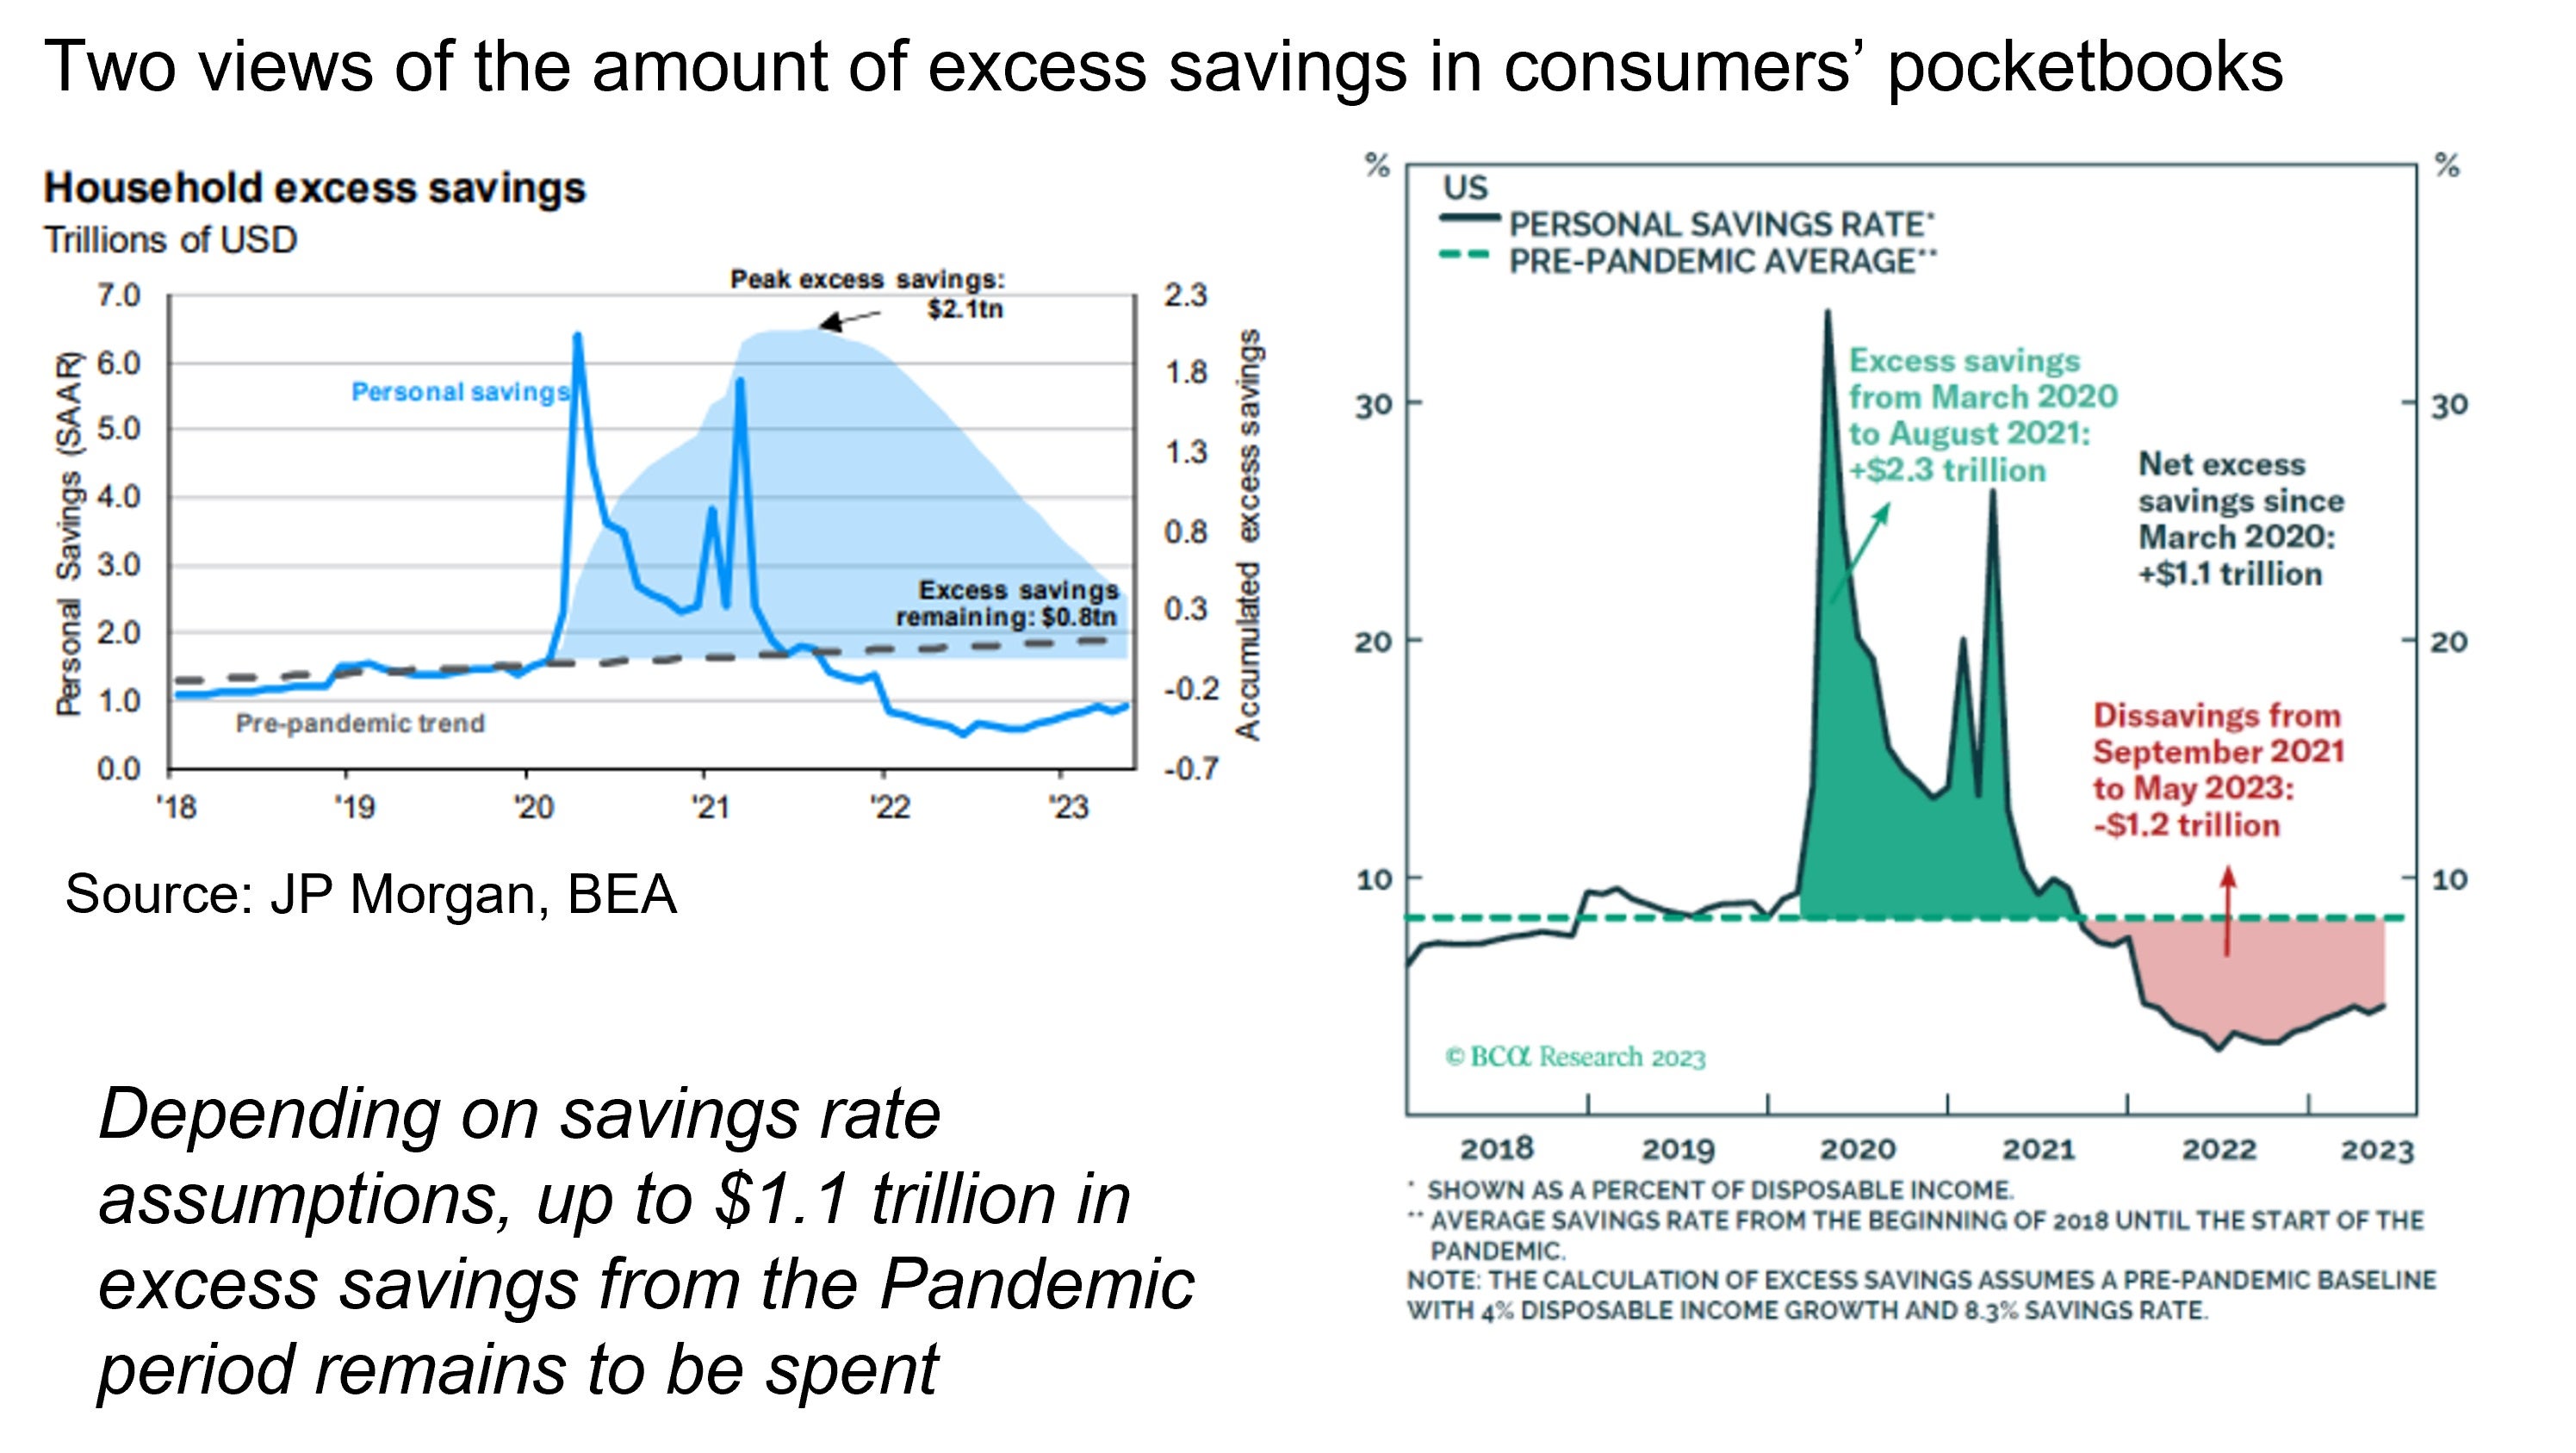
Part of the resilience of the U.S. economy in the face of high-interest rates is the continued tailwind of the pandemic-era economic stimulus. Estimates vary, but of the $2.3 trillion in excess savings built up during the “COVID years,” there seem to be anywhere from $500 billion to $1 trillion remaining to be spent. Some of this excess savings may never be spent, as some may have been lost to speculative investments along the way and quite a bit saved for the long term. Nevertheless, it does appear that the consumer is in relatively good shape.
The risks to the outlook, while growing, seem to be contained … so far.
Consumers are clearly bingeing on services, as anyone who has gone on vacation can attest. Airports are crowded, as are flights. Restaurants are pressed for workers as demand has surged. Strong demand in a supply-constrained economy translates to higher costs. This has prompted the Fed to resume its tightening policies.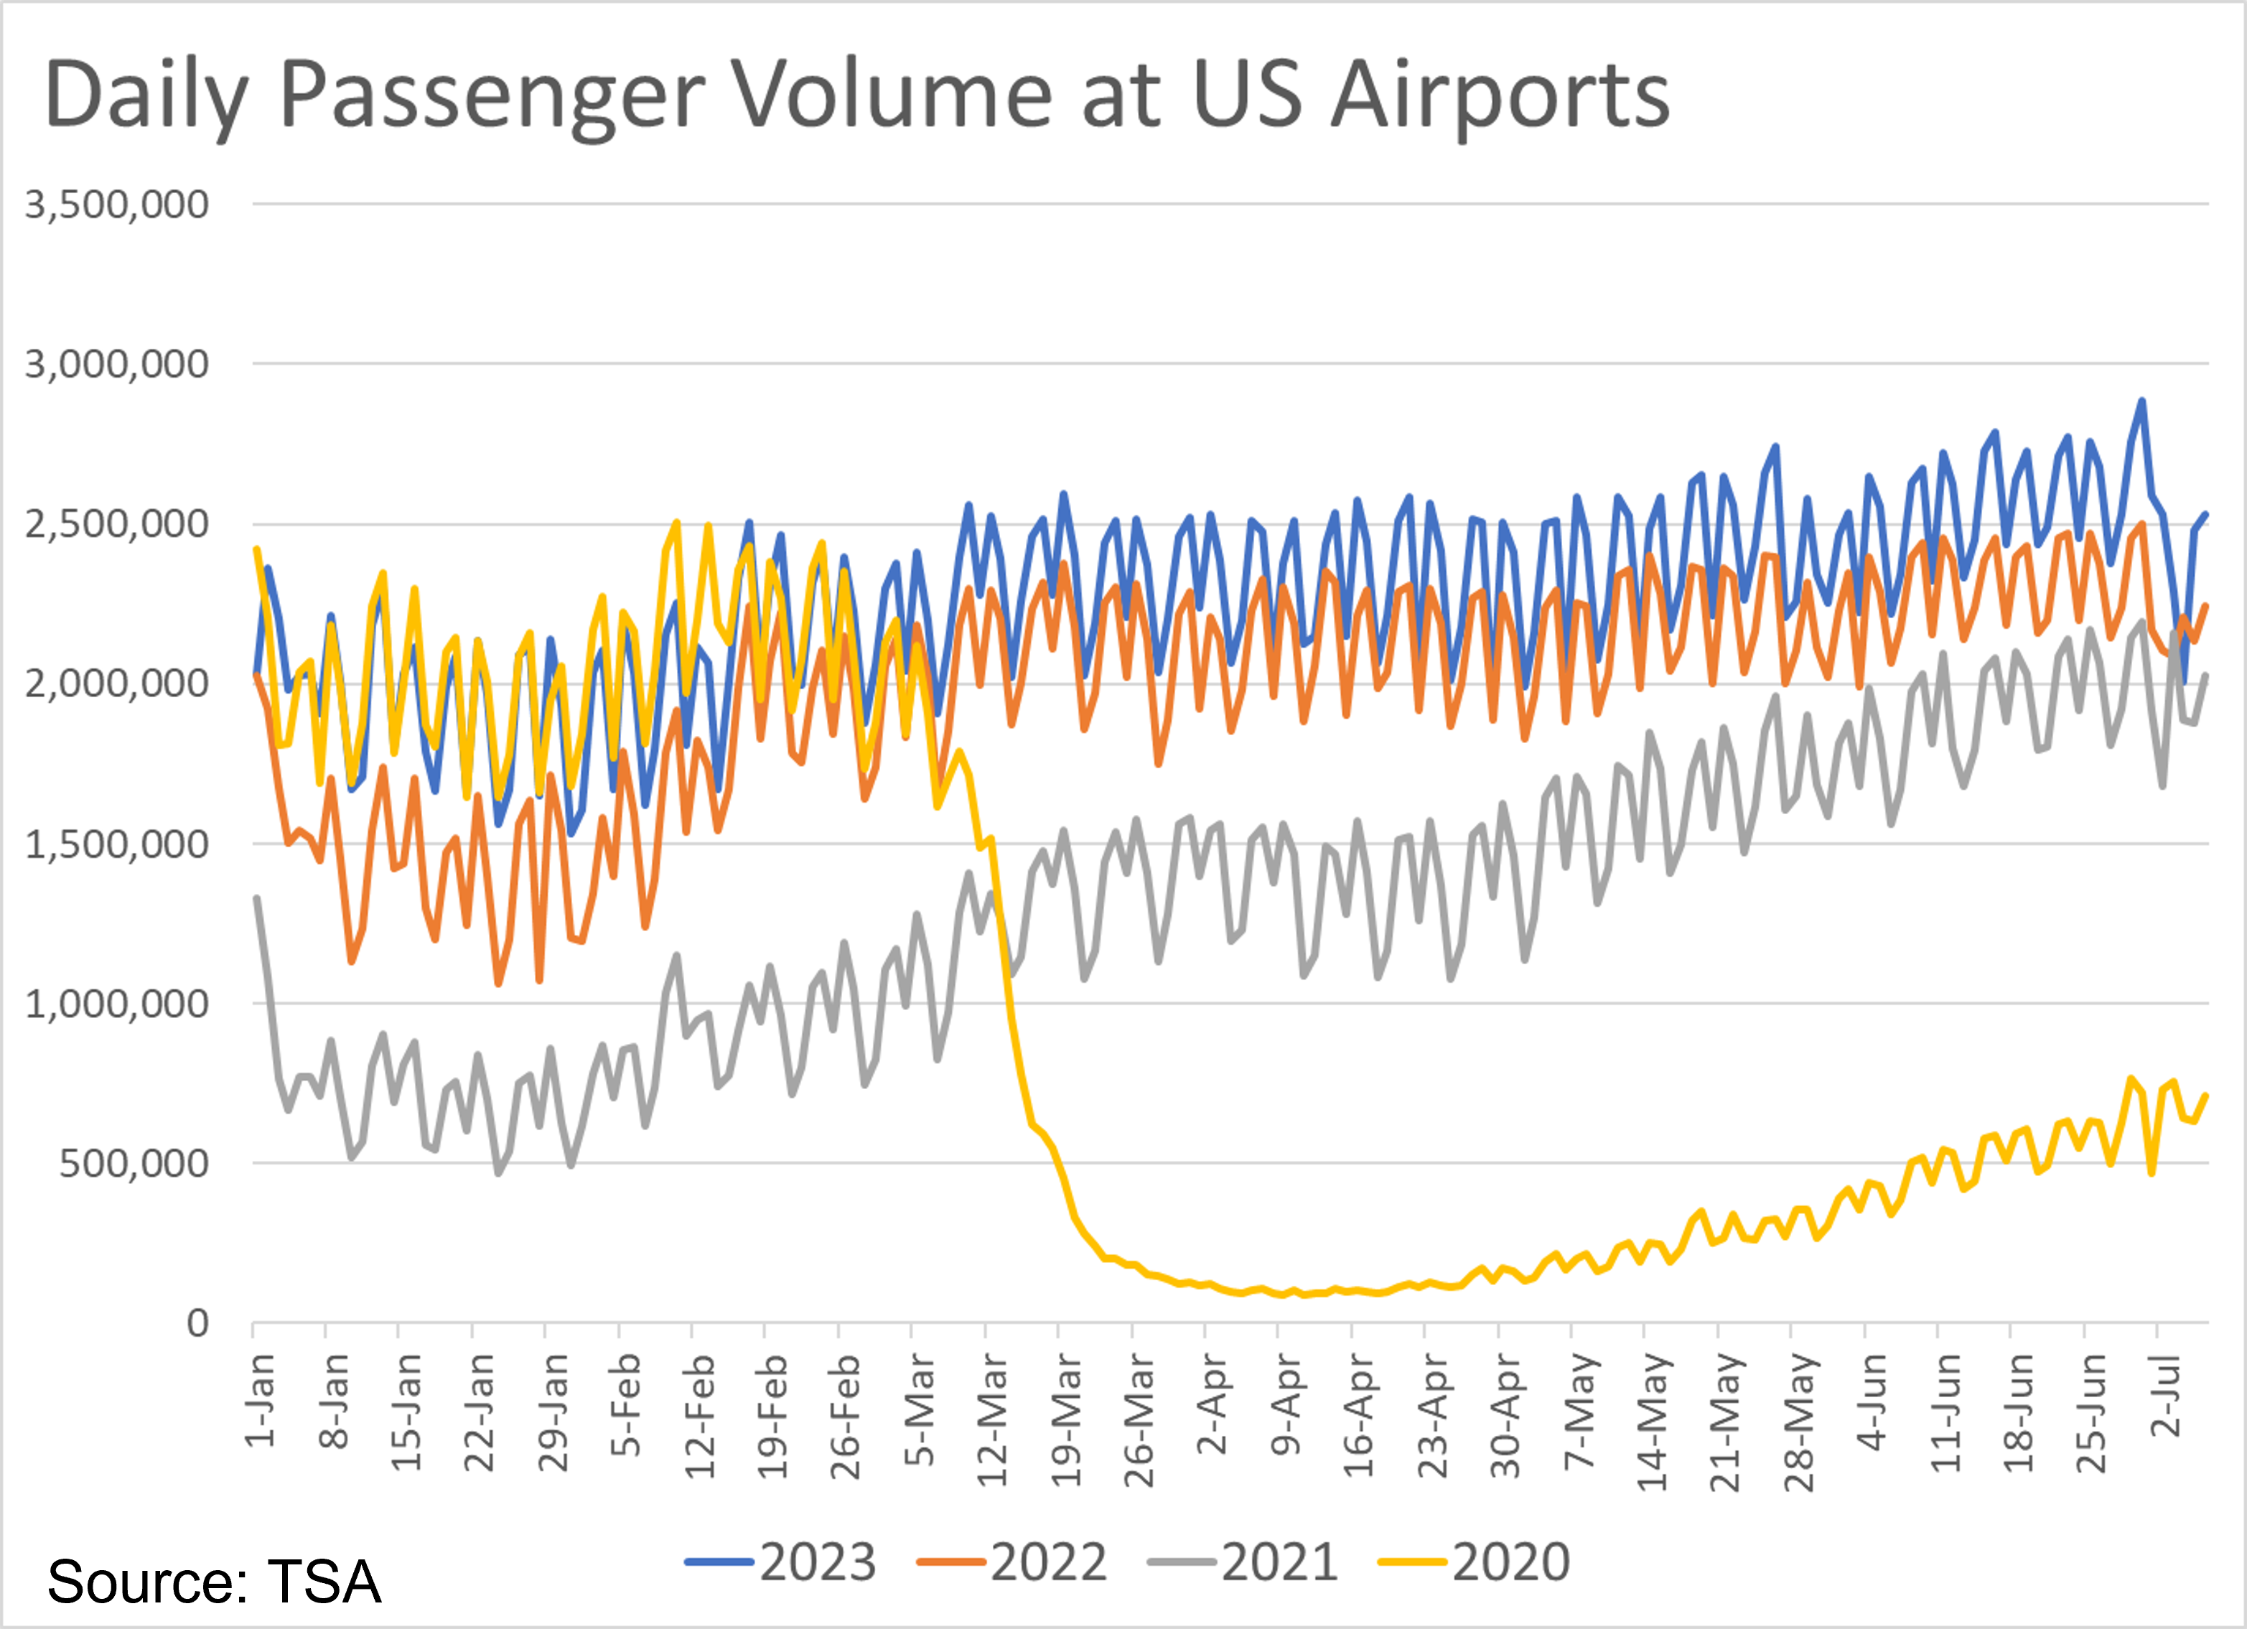
The mechanisms by which the Fed tightening will eventually lead to an economic slowdown are clear, and signs of this taking place are becoming evident on the margins. Even as some consumers spend down excess savings, those who already have are now increasingly turning towards credit cards to maintain spending. Headlines may fret that such debts, now exceeding $1.2 trillion, are at an all-time high. However, this fails to recognize that in real, inflation-adjusted terms or as a share of disposable income, the increase appears to be more modest. Overall, the household debt service ratio has not quite risen to levels seen before the pandemic and remains lower than historical averages. While this bodes well for future spending, there are some growing concerns that the higher interest rates are contributing to a rise in auto loan and credit card delinquencies, which have accelerated. By the end of the year, student loan repayments will also have resumed. According to Moody’s Analytics, full repayments on student loans presently in forbearance could reduce annual GDP by as much as 0.3%.
Other risks to the economic outlook include continued problems in commercial real estate, especially office building vacancies. Already, there has been a significant amount of deleveraging and workouts. Given the authorities’ actions to shore up confidence in the banking industry, the fallout appears to be well contained. There has been a meaningful tightening in credit conditions and lending, which is assisting with the cooling of the economy.
The global backdrop is also helping to cool conditions. China’s reemergence from Covid did not result in a surge in economic activity as the country remains saddled with its own real estate woes and sagging consumer confidence. The Bank of China has lowered interest rates to stimulate the economy, and many observers expect the government to announce additional stimulus measures in the near term. In the meantime, a slower China reduces demand for natural resources, helping to stem inflation.
Major trading partners in the developed economies continue their own battles against inflation and continue to hike interest rates, even as their economies slow markedly. Following two quarters of negative growth, Germany may have tipped into recession and the United Kingdom is seeing a sharp slowdown as well. Both the European Central Bank and the Bank of England are raising rates in the face of inflation that is higher than here in the United States. Success in the battle against inflation abroad should translate into an easier transition to lower inflation domestically.
Federal Reserve rate hikes to end later this year
We expect the decline in inflation during the second half of the year will put an end to the Fed’s tightening program, possibly before the end of the summer. The labor market should begin loosening by then, as tighter credit conditions and the exhaustion of excess consumer savings leads to slower economic growth. Given the lag between rate hikes and their impacts, we would not expect an actual recession until 2024. Even then, it could be a mild episode, because there is room for the Fed to provide stimulus by cutting interest rates. We do not expect the Fed to cut rates until a more marked slowdown is apparent, which we do not expect until 2024, given present conditions.
The markets year-to-date: An upside-down world
Yogi Berra famously said, “It is hard to make predictions, especially about the future.” Consistent with that comment, the first half of 2023 was expected to be a rough one, with headwinds as far as the eye could see. These headwinds included: slowing economic growth, the Federal Reserve’s steadfast commitment to raising rates to quell inflation, geopolitical risks (the ongoing Russia-Ukraine war, China’s aggression toward Taiwan) and the U.S. debt ceiling.
A December 2022 Barron’s magazine poll of leading market strategists expected markets to fall in the first half of 2023 before rebounding as the 2024 outlook improved. It expected U.S. GDP growth to fall well below 1% and the S&P 500 to end the year up 9%. The poll expected that the Fed Funds target rate would range between 4.5-5%. It also expected value-oriented U.S. sectors such as energy and financials would be the best performing sectors, and finally, growth-oriented sectors like consumer discretionary would be the worst performing sectors.
Fast forward to June end, and the strategists were less than 50% correct. U.S. GDP growth is trending toward 2% for Q2 (up from 1.3% in Q1), the S&P 500 is already up 17%, the Fed Funds target rate ranges between 5-5.25%, growth-oriented sectors regained leadership over value-oriented sectors with tech and consumer discretionary sectors leading, and energy and utilities sectors lagging. Bonds regained their rightful place as a ballast in diversified portfolios, while 2023 S&P 500 earnings-per-share (EPS) growth is set to be flat compared to 2022. This is a far cry from the earnings recession widely anticipated at the start of the year. In addition, developed and emerging markets lagged the S&P 500’s performance, up 12% and 5% year-to-date (YTD) respectively. The developed and emerging markets were weighed down by China’s underwhelming -5% return, which was the worst among major emerging markets).
Broad market thoughts for the second half of 2023
While a couple of well-chronicled market headwinds have eased, i.e., the U.S. debt ceiling is farther along and the Fed seems to be nearing the end of monetary tightening, we are far from being out of the woods yet. As we anticipate what might be the most well telegraphed (and likely shallow) recession, it is a coin toss as to whether it will occur toward the end of 2023, sometime in 2024 or long after. The leading triggers for such a recession are likely to be rising jobless claims and layoffs, widespread credit distress amongst consumers, a banking crisis or a deteriorating global corporate earnings picture.
At the start of 2023, it seemed a given that we would revisit the bear market lows of October 2022 (using the standard 20% drawdown definition). Instead, using that date as the starting point and adopting the 20% upward move definition for a bull market, the S&P 500 closing price on June 8, 2023 met (at least temporarily) the technical definition of an informal “bull market.” This marked one of the longest time periods since 1947 that the market had taken to rise 20% off of prior lows. In the past several periods since 1950, when the market rallied 20% off the lows, thus ending the prior bear market, there was short-term selling as investors took profits. However, six and twelve months later, the median S&P 500 market performance was notably positive. As they say, the cure for high prices is sometimes higher prices.
Being fans of financial market history, we looked to the past to see if there were parallels to the current market. We found few, given the unprecedented rate of change in interest rates over the past 18 months and the concurrent rise-then-fall in inflation. While parallels to help us chart the course for the year’s second half market performance are few and far between, the conditions seem ripe for a near-term pullback of sorts in the U.S. markets. This is due to higher-than-average valuations, room for earnings disappointment and a high degree of complacency as measured by the VIX index (which tracks the implied 30-day volatility of the S&P 500) hovering at 2-year lows. In at least one respect, the first half of 2023 may be tracking the past. Historically, the second year of a Presidential cycle (here, 2022) typically has the weakest returns within a 4-year cycle, while we will have to see whether the third year of this Presidential cycle (2023) will have the strongest returns as it has in the past.
Portfolio positioning: Balancing short-term liquidity and long-term investment needs
2022 was a year to forget, when bonds gave up their place as the safety cushion within a diversified portfolio and declined double-digits. 2023 has been a more run-of-the-mill year, with most bond categories up, anywhere from low to mid-single digits. Through much of last year, we were rightfully favoring shorter-term durations, as we expected an onslaught of Fed rate hikes to drive yields up and prices down. Few expected the bond markets to suffer as much as they did, putting a dent into most diversified portfolios. Cash-like instruments such as CDs or money-market funds are a decent place to hide out while satisfying short-term liquidity needs, as yields have risen alongside rates. With yields on such instruments and treasury bills hovering near 5%, we understand why a record-high $5.4 trillion resides in money market funds. However, if the end of the rate hike cycle is near and yields are closer to peaking, we believe adding to core bonds would suit investors better. This is because core fixed income tends to outperform cash when rates are likely to move lower. Additionally, short-duration cash instruments face reinvestment risk in a world of lower rates.
At the time of this writing, we are evaluating whether to further increase the duration of our fixed-income portfolios. With investment grade bonds offering yields between 5-6%, we believe these might be a better place to invest over cash. Despite yields in the 7-9% range for high-yield bonds, we believe it is too early in the cycle to invest here since there may be rising defaults if the economy slows and we see distress in areas like real estate, levered cyclicals and smaller poorly capitalized regional banks. In a “higher for longer” rate environment and given the melt-up that equity markets have had in 2023, bonds also offer better risk/reward than stocks. One way to gauge this is to compare the S&P 500 index’s earnings yield (the inverse of the price-earnings ratio) which stands at 5%, comparable to the yield on an intermediate-term bond. But, the S&P 500 brings with it much higher volatility than the average bond.
From the standpoint of the equity markets, 2023’s rally has largely been driven by growth-oriented technology and consumer discretionary sectors which, after a tough 2022, appreciated 20%+ (YTD). Much of the S&P 500’s rally was driven by seven large-cap stocks (Apple, Amazon, Alphabet, Meta Platforms, Microsoft, Nvidia and Tesla), which have appreciated about 40%-190%, while the rest of the S&P 500 treaded water. Performance within this handful of stocks has partly driven the S&P 500 index valuations higher, so much so that the S&P 500 Forward P/E ratio is now at 19.5x making it 20% overvalued. Excluding these stocks leaves the index valuation at a more modest 16.5x, which is more in line with historical averages.
Typically, during past recessions, earnings for the S&P 500 have declined in the double-digits. The consensus is currently projecting flat 2023 earnings per share (EPS) growth for the S&P 500 to $220. And, the consensus projects 12% EPS growth for 2024 to $246. For an economic recession to occur, we would need an earnings recession. As it stands, financials (led by banks) would seem to be prime candidates to lead an earnings contraction in an environment where margins and net interest income get squeezed. In an environment of slowing growth and falling inflation, tech could lead the way, especially given how much of the industry has already righted itself better than most sectors. We believe that portfolios should remain relatively style neutral with a bias toward large-cap equities. However, should we see signs that the markets are about to turn a corner, we stand ready to take a more aggressive posture toward growth and small-cap equities. Small-cap equities trade at a 30%+ discount to large-cap equities.
The artificial intelligence (AI) conundrum: Opportunity or fad?
Finally, we would be remiss to not briefly mention the recent excitement around AI. Much of the Nasdaq’s torrid run this year has been on the lack of excitement around AI’s potential impact on the broader economy, as well as multiple sectors. AI is still relatively nascent and is, in our view, somewhere in the second inning in terms of commercial deployment. There is potential revenue generation of billions of dollars for software, hardware and services. However, it is hard to pinpoint the exact scale and scope of AI adoption and the potential disruption it will bring to various industry sectors in the decades ahead. To us, it appears that AI could have far reaching impact on our lives, including the way we search for information, administer healthcare, how we practice law and automate many of the routine tasks we do in our daily lives, thus allowing firms to achieve greater productivity by doing more with less.
Due in part to the hype around AI, large technology companies within the Nasdaq regained most of the ground lost in 2022. Large-cap tech beneficiaries such as Apple, Microsoft and Nvidia hit multi-year highs. In fact, with nearly 20% of the S&P 500 comprised of the largest seven tech mega-caps, the market-cap weighted S&P 500 has outperformed the equal-weighted S&P500 index by nearly 10% YTD. Our portfolios do not have direct exposure to companies that are pure plays on the AI revolution since most AI companies are private. However, we do have indirect exposure through external investment managers that own most of the above companies within their funds or through equities (in legacy equity portfolios). Stay tuned for our future thoughts on these and other relevant market topics!
Wealth Advisory Services does not provide accounting, legal or tax advice. This information discusses general economic and market activity and is presented for informational purposes only and should not be construed as investment advice. Views and opinions expressed herein do not account for any specific investment objective, restrictions, and/or financial circumstances of any specific client. Investors are urged to consult with their financial advisors before buying or selling any securities.
Different types of investments involve varying degrees of risk, and there can be no assurance that any specific investment will either be suitable or profitable for a client’s investment portfolio. The investment return and principal value of investment securities will fluctuate based on a variety of factors, including, but not limited to, the type of investment, amount and timing of investments, changing market conditions, currency exchange differences, stability of financial and other markets, and diversification. The statements and opinions expressed in this article herein are those of the author as of the date of the article and are subject to change. Content and/or statistical data may be obtained from public sources and/or third-party arrangements and is believed to be reliable as of the date of the article.
Products offered through are not FDIC Insured, are not bank guaranteed and may lose value.